
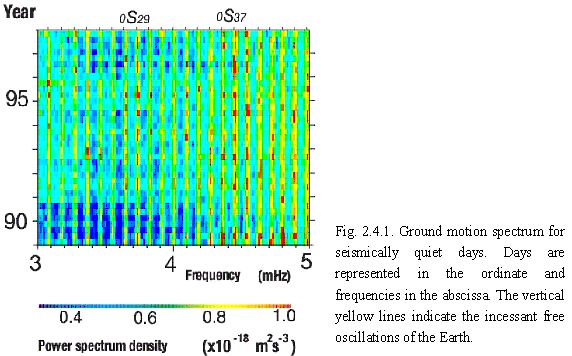
| The discovery of incessant excitation of the free oscillations of the Earth started from the analysis of 3-year superconducting gravimeter data recorded at Syowa, Antarctica, as part of the OHP (Nawa et al., 1998). Numerous subsequent papers (e.g., Suda et al., 1998; Kobayashi and Nishida, 1998) confirmed that incessant oscillation is a global-scale phenomenon by analyzing continuous recordings of global seismic networks. The power spectrum of the continuous free oscillation shows clear seasonal changes, with the power being larger in the Northern Hemisphere winter and smaller in summer; this trend is common to all quiet seismic stations. Another prominent feature of the power spectrum of the oscillation is the excess amplitude of specific spheroidal normal modes, which are known to couple to long-wavelength acoustic modes trapped in the atmosphere. This resonant oscillation between the solid Earth and the atmosphere is termed Earthfs hum (Nishida et al., 2000). |
 |
| These observations led the idea that the main source of the continuous oscillations is atmospheric turbulence within thermal convective motion in the troposphere, as powered by solar influx via heating of the ground beneath the turbulent atmosphere. Modeling of the frequency-dependence of the observed power spectrum was conducted by assuming the ground surface is randomly and homogeneously buffeted in space and time by the atmospheric turbulence (Fukao et al., 2002). Parametric fitting in the modeling was successful only in the limited frequency band below 10 mHz and by assuming a characteristic scale length of the atmospheric turbulent motion. A 2-year local barograph array observation was conducted to measure the characteristic scale length of the atmospheric turbulence (Nishida et al., 2005). The barographic array observation demonstrated that the largest source of the atmospheric turbulence is wintertime wind, while measurement of the characteristic scale length was inconclusive in determining if atmospheric turbulence is the primary cause of the continuous free oscillations of the Earth. |
| Another powerful source of the continuous free oscillations of the Earth is within the ocean. Watada and Masters (2001) analyzed continuous ocean bottom pressure records from the deep sea and identified three characteristic features that support the oceanic excitation hypothesis: (i) the pressure power spectrum at the ocean bottom in the frequency range of 1-10 mHz is larger than the atmospheric power by one or two orders of magnitude, (ii) the frequency dependence of the power spectrum at the ocean bottom resembles that of the observed power spectrum of the continuous free oscillations, including the sharp drop in power beyond 10 mHz, and (iii) the spectrum power reaches a maximum during winter. The source regions of the continuous free oscillations can be directly determined from the analysis of the global broadband seismic array. The results show that seasonal and geographic changes of the excitation sources from the Pacific during November to February to high latitudes of the Southern Hemisphere from June to September, consistent to the oceanic excitation hypothesis. |
| There are thee kinds of waves in the atmosphere in the frequency band above sub-milihertz: acoustic waves, Lamb waves, and gravity waves. These atmospheric waves are excited by various sources and mechanisms such as volcanic eruptions and earthquakes, and are observed as atmospheric pressure changes and ionospheric perturbations at distance sites. In research into active volcanoes, a simple pulse-like acoustic signal of a volcanic explosion directly indicates that the explosion process was simple, while a complex seismogram during a volcanic explosion reflects the propagation effect of seismic waves through the strong heterogeneous body. The harmonic excitation of seismic surface waves following the eruption of Mt. Pinatubo in 1991 at two specific frequencies is an example of resonant oscillations of atmospheric acoustic waves and the spheroidal normal mode of the Earth. |
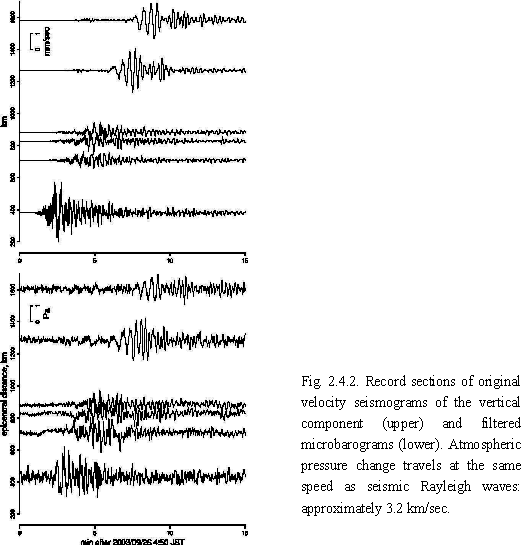
| Watada et al. (2006) demonstrated from microbarometers deployed along the Japanese Islands that atmospheric pressure fluctuated during the passage of the Rayleigh waves following the 2003 M8.3 Tokachi-Oki Earthquake. By examining co-located broadband seismograms and barograms, the authors revealed that the pressure change is caused by ground motion beneath the microbarometers, and thereby constructed a transfer function between the vertical ground motion and pressure change up to a period of about 50 seconds. The observed transfer function is in good agreement with the theoretical transfer function. |
| Observation and analysis of these atmospheric waves, together with ground motion and ionospheric density perturbation records, will help to quantify the excitation sources and reveal previously poorly known behaviors of the Earth. |
 |
| We have been deploying broadband seismometers, together with other geophysical instruments, at active volcanoes in Japan as part of cooperative research projects with Kyoto University, Tokyo Institute of Technology, Tohoku University, Kyushu University, and Hokkaido University. Of the research sites, the deployment at Aso Volcano is notable as it is recognized as one of the best examples in the field of volcano seismology in demonstrating the significance of broadband seismometry at active volcanoes. |
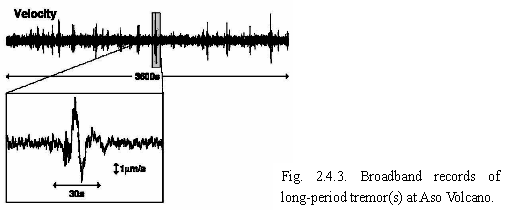
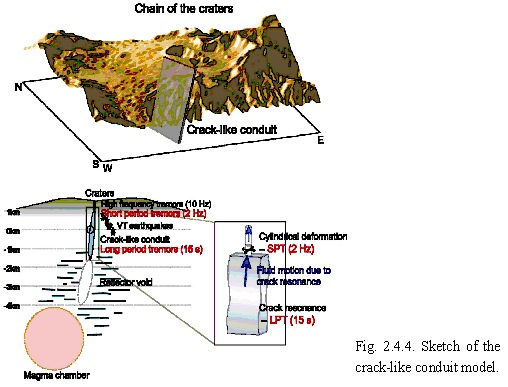
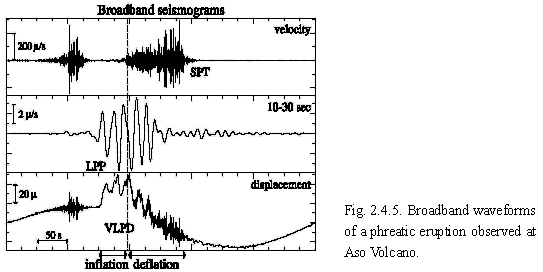
| Our observations using broadband sensors reveal the existence of unusually long-period (15 s) tremors (Fig. 2.4.3) that are continually emitted from the volcano regardless of surface activity and have several common spectral peaks that align with almost equal spacing (15, 7.5, 5, 4 s) (e.g., Kawakatsu et al., 2000). From the amplitude variation of these tremors, we detected the presence of a crack-like conduit whose strike and width are almost the same as those of the chain of craters illustrated in Fig. 2.4.4; this indicates that the chain of craters is the surface expression of a buried crack-like conduit (Yamamoto et al., 1999). Broadband records for phreatic eruptions (Fig. 2.4.5) show that this crack-like conduit also acts as a pressure buffer leading up to eruptions, and thus monitoring of the conduit may be the key to forecasting future activity at Aso Volcano. |
 |
 |
 |
| The existence of the crack-like conduit is also supported by other studies such as the reflection study, and the crack-like conduit is considered as a subsurface path that connects surface craters with a postulated magma chamber at a depth of around 5 km. We also studied the nature of other short-period seismic signals with periods of about 0.5 s and 0.4?0.1 s, using modern digital data obtained from dense array observations. Fig. 2.4.4 schematically summarizes the system beneath Aso Volcano as revealed by seismological analyses (Yamamoto, 2005). Such a line of volcanic conduit systems connecting the magma chamber and the surface has not been detected at any other active volcano in the world. Considering that the various volcanic signals are manifestations of dynamic interactions between volcanic fluids and the volcanic edifice in the conduit system, Aso Volcano appears to be one of the best sites to study the dynamic behavior of the volcanic fluid system beneath active volcanoes. We are currently constructing a real-time monitoring system of the activity of the crack-like conduit and fluid migration beneath Aso Volcano to understand how this system operates when magma rises to the surface in the leadup to an eruption. |
| Volcanoes are good test sites at which to observe the geophysical phenomena of multi-phase systems. In this project we are studying the dynamics of magma transport and oscillation, taking account of coupling with surrounding rocks and the coexistence of solid, liquid, and gas phases within the magma. |
| (1) Propagation and attenuation of acoustic waves within bubble-bearing magma |
| Seismic signals passing from or through a volcano commonly indicate existence of a body or areas with slow sound speed and/or large attenuation, which are interpreted as bubble-bearing magma. Although it is well known in engineering systems that bubbles significantly decrease the speed and increase the attenuation of acoustic waves within the liquid, volcanic systems are more complicated and variable. We have proposed a mathematical model to evaluate the speed and attenuation of acoustic waves in bubbly magma that takes into account the large variation in viscosity and pressure within magma, as well as the diffusion of heat and volatiles, and time-dependent mechanical properties (Ichihara and Kameda, 2004). The mathematical model has been confirmed by laboratory experiments in terms of the effect of viscosity and viscoelasticity (Ichihara et al., 2004). |
| (2) Magma fragmentation and the generation of air-waves |
| Magma fragmentation occurs during explosive eruptions. Such fragmentation transmits pressure waves and magma fragments (pumices and ash) to the air and can cause natural disasters. We are conducting experimental studies of this process that focus on the mechanical properties of magma that control the conditions and behavior of magma, and the generation of pressure waves in the air by magma fragmentation at the ground surface. We measured and analyzed pressure waves in the air transmitted by underwater explosions and detected the influence of the disintegration of the water surface (Ichihara et al., 2005, proceedings). |
| (3) Bubble oscillation in magma and geothermal water |
| The oscillation of a single bubble is a fundamental process within more complicated systems that contain many bubbles. We are investigating the roles of a bubble or bubbles in the onset of volcanic eruptions and earthquakes (Ichihara and Brodsky, 2006). |